
Air dispersion modelling is required in some permitting assessments, but its value in my work has extended beyond preparing a report for a reviewer. On projects I handled, the design team needed an answer: what stack height is appropriate, and what emission reduction should a treatment unit achieve? These questions bring modelling into the engineering decision before the design is fixed and constructed.
From demonstrating compliance to informing design
If assessment begins only after all decisions are complete, its influence is constrained. It may identify a real problem whose solution now requires a late modification. Earlier scenario work can instead reveal which design assumptions matter, which data need confirmation and which alternative deserves development.
That is the practical meaning of data-driven decision-making. Results go back to the designer as well as to the permitting team, helping shape siting, specifications and control options. The model does not design a facility alone; it supplies evidence to a team managing engineering, operational and economic constraints.
The first experience: choosing a stack height
One assignment required an appropriate stack-height decision. I compared alternatives through predicted receptor concentrations, considering project requirements, good engineering practice, building influences and surrounding conditions. The decision could then be explained through documented scenarios rather than an assumed height.
The benefit was not simply making a stack taller. An unsuitable height can create expensive changes later, while an unnecessarily tall structure adds cost without a demonstrated need. The comparison must consider the whole application; height is not a universal substitute for emissions reduction or review of all relevant receptors.
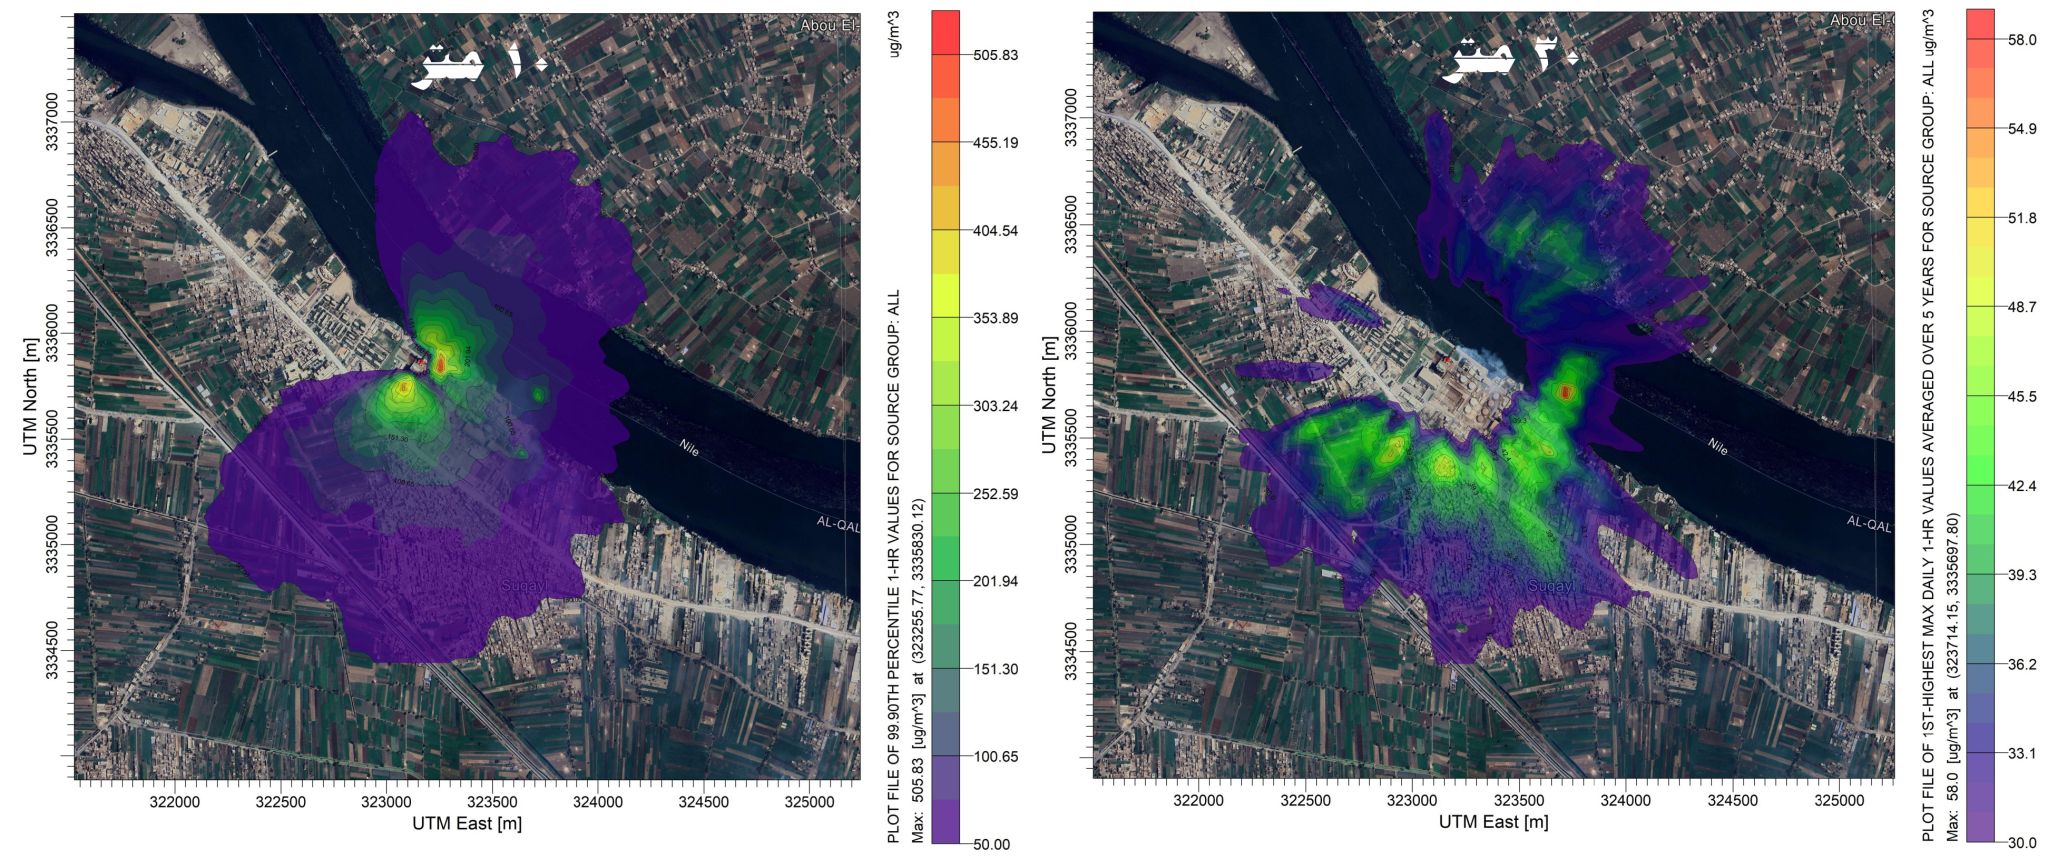
The illustrative 10-metre and 30-metre cases
My original post included an illustrative power-station NO₂ example with stack heights of 10 and 30 metres. The point was that dispersion calculations concern predicted concentrations at receptors or ground level, rather than the gas concentration inside the stack outlet.
The post discussed values around 500 µg/m³ for one case and around 50 µg/m³ for the other to illustrate the possible scale of a scenario change. These were values from that example, not a rule that the same increase in height produces the same ratio everywhere. Compliance also depends on averaging period, statistic, background and comparison basis, not the bare number.
The original figure’s legends use different statistical descriptions. It is therefore retained as the original illustration of scenario selection, not presented as a complete like-for-like quantitative compliance comparison. Such a comparison requires harmonising the statistic and reviewing the result files.
The second experience: an odour-control unit
A wastewater-treatment project concerned an Odor Control Unit. We needed to connect its expected release with conditions around the site, then examine the reduction needed in the assessed scenario so performance could be discussed with the supplier.
The calculation direction matters: source and release evidence are established first, then dispersion modelling evaluates assumed discharge or reduction scenarios at receptors. It does not replace measurement or calculation of the original emission rate. It can help investigate the assumed rate or control efficiency needed for a defined assessment objective.
Turning a result into a supplier requirement
Once scenarios are reviewed, findings can be translated into an understandable performance requirement. Instead of requesting a generally “good” odour-control unit, the discussion relates to a defined source, operation, location, receptors and assessment basis.
This links treatment design to site conditions while retaining the supplier’s responsibilities for engineering, guarantees and test conditions. A reduction assumed in a model is not proof that a unit will achieve it under every operating condition. The study and equipment specification need compatible definitions of performance.
Why timing affects cost
Imagine constructing a stack before discovering that the required alternative needs a substantial change, or buying treatment before defining the necessary performance. A comparison that could have been made on paper can become a construction, replacement or downtime expense. Conversely, a project may pay for specifications beyond a justified need.
Early comparison does not eliminate uncertainty. It makes uncertainty visible while the team can still respond. That is how modelling contributes to developing a solution instead of becoming a document describing decisions already made.
GIGO: the quality of the decision begins with evidence
I ended the original post with Garbage In, Garbage Out. Incorrect emissions, meteorology or source definitions can generate visually convincing results on a weak foundation. My accompanying “Gold In, Gold Out” expression emphasised input quality, but good data do not remove every model limitation.
I retain scenario tables, changed inputs, evidence sources, relevant receptor results and assumptions needing confirmation. Model documentation also supports appropriate application. [1] The designer and reviewer should be able to understand why an alternative is preferred, not merely observe a lower value.
References & original writing
Adapted and expanded from the author’s LinkedIn writing. Technical references are listed below.
